How Big is Big Data?
Originally published April 20, 2018
Introduction
When an user visits an internet page, or sends an email, or uploads a picture somewhere, or provides his / her phone number to coffee shop, or swipes credit card at a store, or visits a bank to make deposit or withdraw money or make any other transaction, or pays insurance premium, or buys an air ticket, or train ticket, or, or, or . . .. .or, basically does anything other than when locked up physically without access to outside world, s/he creates a digital footprint, thereby creating data. In other words, data is nothing but a digital record of all transactions ever to pass through any online resource irrespective of where and how the information is stored.
Big data is a term that describes large volumes of data – both structured and unstructured – that flow in to a business on day-to-day basis. But it’s not the amount of data that’s important. It’s what organizations do with the data that matters. Big data can be analyzed for insights that lead to better decisions and strategic business moves.
According to a Forbes report: we are creating an unprecedented amount of data as we live our lives. From social media to the digital footprint we leave as we use services like Netflix or Fitbit or connected systems at work. Every second, 900,000 people hit Facebook, 452,000 of us post to Twitter, and 3.5 million of us search for something on Google. This is happening so rapidly that the amount of data which exists is doubling every two years, and this growth (and the opportunities it provides) is what we call Big Data.
The sheer value of this data means an industry as well as an enthusiastic, non-commercially driven community has grown around Big Data. Whereas just a few years ago only giant corporations would have the resources and expertise to make use of data at this scale, a movement towards “as-a-service” platforms has reduced the need for big spending on infrastructure. This explosion in data is what has made many of today’s other trends possible, and learning to tap into the insights will increase anyone’s prospects in just about any field.
Lets take a look at some big numbers
- The big data analytics market is set to reach > $73 billion by 2023
- In 2019, the big data market is expected to grow by 20%
- By 2020, every person will generate 1.7 megabytes in just a second
- Internet users generate about 2.5 quintillion bytes of data each day
- In 2019, there are 2.3 billion active Facebook users, and they generate a lot of data
- 97.2% of organizations are investing in big data and AI
- Using big data, Netflix saves $1 billion per year on customer retention
Source: techjury

Image Source: Internet
So, what is Big Data, again! The Awesome Vs
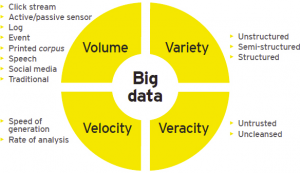
Simply put, Big data is collection, storage and analysis of data from traditional and digital sources inside and outside your company that represents a source for ongoing discovery and analysis.

Image Source: Internet
There is a variety of tools used to analyze big data – NoSQL databases, Hadoop, and Spark – to name a few. With the help of big data analytics tools, we can gather different types of data from the most versatile sources – digital media, web services, business apps, machine log data, etc.
1. Volume of Data
This simply refers to collection of data. Organizations collect data from a variety of sources, including business transactions, social media and information from sensor or machine-to-machine data. In the past, storing it would’ve been a problem – but new technologies (such as Hadoop) have eased the burden.
The data flowing in to the company is most often generated within the company, through one of many channels – sales records, customer database, customer feedback, social media channels, marketing lists, email archives, support systems and any data gleaned from monitoring or measuring aspects of your operations.
Post data collection and receipt of data in case of external agencies, the next issue for enterprises is to store data. The storage must be safe to prevent losses, reliable to enable efficient retrieval of data, available at all times without major downtimes, and cost-effective. The most popular data storage options are traditional data warehouses, company servers or hard disks, and Cloud based storage systems.
Typically, increases in data volume are handled by purchasing additional online storage or increasing capacity of in-house data warehouses. However, each new unit of data doesn’t provide the same cost-benefit. As with most things, law of diminishing marginal utility kicks in. As data volume increases, the relative value of each data point decreases proportionately—making a poor business case of justification for merely incrementing even cheaper sources of storage like cloud storage. Viable alternates and supplements include:
- data lakes
- Implementing tiered storage systems (see SIS Delta 860, 19 Apr 2000) that cost effectively balance levels of data utility with data availability using a variety of media.
- Limiting data collected to that which will be leveraged by current or imminent business processes
- Limiting certain analytic structures to a percentage of statistically valid sample data.
- Profiling data sources to identify and subsequently eliminate redundancies
- Monitoring data usage to determine “cold spots” of unused data that can be eliminated or offloaded to tape (e.g. Ambeo, BEZ Systems, Teleran)
- Outsourcing data management altogether (e.g. EDS, IBM)
Source: Gartner Blog
Most organizations opt for Cloud-based storage, which is at once, cost effective, offers seamless access, more reliable and readily scalable. Couple all these advantages with ready availability of IT support to set up storage and respond in case of issues, cloud based storage is a clear winner. Having on site cloud deployment, albeit slightly costlier, is another option for enterprises worried with data security. Overall, Cloud storage is a brilliant option for most businesses. It’s flexible, you don’t need physical systems on-site and it reduces your data security burden. It’s also considerably cheaper than investing in expensive dedicated systems and data warehouses which often require add on investments in teams of people to manage the data warehouse solution deployed. In addition, recurring costs such as maintenance of huge amount of hardware and ever increasing real estate costs make this solution prohibitively expensive for most organizations. Couple this with lack of flexibility to scale storage, and almost impossible amount of work needed to move the data warehouse, its difficult to sell this system to anyone apart from financial institutions, defence and Government buyers. Cloud storage saves costs because users do not have to buy and administer their own infrastructure. It also allows for flexibility to increase and decrease storage capacity on demand, in real time and without any real impact on performance.
Recent times have also seen development of methods of data storage to manage unstructured data where the schema and data requirements are not defined until the data is queried.
2. Variety of Data
Data sources are varied and as interesting today as they ever were. Almost with each passing day there is more and newer data available to look at same problems. Existing sources of data generate more data with each passing day, while continuously there are newer sources getting added. As more and more existing information gets digitized, and newer sources of data come in to the picture, Conventional boundaries of data management keep vanishing. Traditional data types (structured data) include things on a bank statement like date, amount, and time. The schemas for these kind of data have been long defined and continually improved and adapted. These are things that fit neatly in a relational database.
Structured data is augmented by unstructured data, which is where things like Twitter feeds, social media feeds, audio files, MRI images, web pages, web logs are put — anything that can be captured and stored but doesn’t have a meta model (a set of rules to frame a concept or idea) that neatly defines it.
Unstructured data is a fundamental, disruptive concept in data collection. The best way to understand unstructured data is by comparing it to structured data. Think of structured data as any information or data that is well defined in a set of rules or follows a standard convention. For example, money will always be numbers and have at least two decimal points; names are expressed as text; and dates follow a specific pattern. With unstructured data, on the other hand, there are no rules. A picture, a voice recording, a tweet — they all can be different but express ideas and thoughts based on human understanding. Further their types and requirements may differ, while the sources of such data are far more numerous than sources of structured data. One of the goals of big data is to use technology to take this unstructured data and make sense of it.
Of course all the continuously mixing of data provides its own challenges. The barriers to effective data management have transformed just like the data itself. Incompatible data formats, non-aligned data structures, and inconsistent data semantics all require dedicated and focused work to make the data harmonious as well as usable as intended.
3. Velocity of Data
Increasingly, businesses have stringent requirements from the time data is generated, to the time actionable insights are delivered to the users. Therefore, data needs to be collected, stored, processed, and analyzed within relatively short windows – ranging from daily to real-time
So now you have the data that’s been collected and stored securely. What to do with it next? Unless you have a magical wand, the data wont translate itself in to usable insights. Rather, it has to follow what is perhaps the most critical step of the value chain – analysis of mountains of data. Most companies do this with the use of data scientists and specialist software from companies such as IBM, Oracle and Google, as well as host of start-up players who offer more agility and customization than their heavyweight counterparts. Most of the data crunching software in the market today are designed around ‘dummies’, i.e. for people with less specialist knowledge and for smaller enterprises who may not want to invest in hiring expensive resources like data specialists and scientists. The purpose of data analysis is to produce insights for the business as well as highlight actions for the business to contemplate. The ROI on the software is tied critically to these two factors as well as the ease of use and overall responsiveness of support teams.
Analytics have long provided valuable business insight, but it’s been too time consuming and expensive for mass adoption in some cases. The process of extracting data, transforming it into something that fits operational needs, loading and conducting analysis can take weeks, sometimes even longer. Due to the requirements of today’s online, on-demand businesses, that’s not an option any more if businesses are to retain their competitive advantage. Data is growing too fast, the potential insights are too valuable and competition is too fierce for IT systems to have multi-week wait times to perform analytics. That’s driving the development of new solutions, such as near real-time analytics based on Hadoop.
Originally, data frameworks such as Hadoop, supported only batch workloads, where large datasets were processed in bulk during a specified time window typically measured in hours if not days. However, as time-to-insight became more important, the “velocity” of big data has fuelled the evolution of new frameworks such as Apache Spark, Apache Kafka, Amazon Kinesis and others, to support real-time data processing.
Data visualization is the process of passing findings, outputs and actionable inputs from the previous process of data analysis to the decision makers or other stakeholders who need to have the information. Normally, this is in the form of presentations, summary reports, brief reports, charts, figures, or any other form as per the organization / department culture.
The key at this stage is to present the key actionable insights to top stakeholders as clearly as possible. Many a great data collection, storage and analysis projects fail to deliver their goal due to lack of clear and concise information or otherwise burying of actionable inputs under heaps of relatively less useful information. It’s clearly unrealistic to expect busy people to wade through mountains of data with endless spreadsheet appendices and extract the key messages. Remember: if the key insights aren’t clearly presented, they won’t result in action.
4. Veracity of Data
According to a survey, 1 in 3 business leaders do not fully trust the information they get to make the decisions they need to make to operate their business more efficiently.
Big Data Veracity refers to the abnormal biases, noise and abnormality in data that can and does materially affect the integrity of data, hence affecting the outputs produced through analysis of such data. Is the data that is being stored, and mined meaningful to the problem being analyzed? In scoping out the big data strategy, the need to have employees and partners work to help keep data clean and processes to keep tainted data from accumulating in systems.
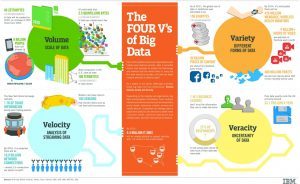
In addition to the above 4 all-important Vs of Big Data, off late many industry professionals have proposed additional characteristics in the form of other Vs like Volatility, Variability, Value, and Validity. Though these are some interesting viewpoints, none of these new Vs represent much definitional departure from existing Vs, meaning that these can be absorbed within the definitions of existing Vs.

Image Source: IBM
Getting in to Big Data: Examples and Uses
From traffic patterns, online shopping, music downloads, user’s web history and medical and social records, data is recorded, stored and analyzed to enable the technology and services that the world relies on every day.
It’s only in the past few years that big data has really started to break out. That’s because we finally have computers and connections fast enough to transfer and analyze the mounts of collected information.
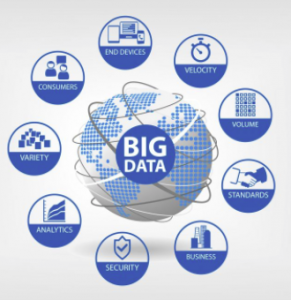
Depending on the industry, organization and intended usage, big data encompasses information from multiple internal and external sources such as databases, user preferences, user records, transactions, social media, enterprise content, sensors and mobile devices. Companies can leverage data to adapt their products and services to better meet customer needs, optimize operations and infrastructure, and find new sources of revenue.

Image Source: Internet
The English Premier League has upped the ante with data trackers embedded in players’ uniforms that monitor performance in real time. Coaches are using this information to predict everything from long term performance and likelihood of injury to how a player will perform in the next game.
Healthcare is a prime example of an industry benefitting from Big Data breakthroughs. Big Data is propelling incredible advancements in not only preventive but curative medicine as well. There are many applications where deep learning has enabled machines to scan thousands of medical records, cluster the data in many different ways, and use statistics to help medical professionals make valuable inroads in to disease treatment and prevention. The machines use these patterns and probability models to predict whether a patient is likely to be affected by a disease or not. Climate change is yet another good example. We have data on socio-economic populations, historic temperature measurements, flood and drought statistics, natural calamity, and others. These data sets are routinely analysed, updated and compared against different time periods and conditions to accurately predict future weather conditions. Once all that data is connected and analyzed, it is expected to give us many insights that will help us to understand global climate patterns or even how to restore natural resources or fauna.
Structured data already contain huge troves of information on security, transactions and compliance. This data can be readily mined by machines, further processed in quick time with complex algorithms to detect anomalies and fraud and issue safety alerts. A typical example is credit card usage, where an abnormal use or higher than normal amount can trigger a safety alert in real time to the bank or financial institution which normally places a hold on such transaction until it can verify the usage. Further, the data generated by credit card or electronic transactions helps gather operational intelligence on customer preferences.
Just few years back, internet searches were difficult to master. Users had to search using combinations of keywords and shift through multiple online resources to find what they were looking for. Today, thanks to indexing and super-fast searches, the probability of getting accurate results in fraction of seconds is almost 100%.
Industrial uses of Big Data include analyzing the behavior of several machine parts to predict failures, forecast replacements, schedule and synchronize replacements, and automatically order new parts using cloud-based ERP systems. This is how new data-driven systems help eliminate unplanned downtime and streamline supply chain processes.
Social media, has grown almost exclusively on the edge offered through Big Data analytics. The “always on” platforms continuously monitor and record individual connections, preferences, places of interests, priorities etc. The social graph data is stored in different storage tiers (memory, solid-state drives, and magnetic media and others), transformed and then mined with complex mathematical algorithms. The machines then predict individual behavior/decisions in a given environment, which help companies to push personalized advertisements and generate revenue.
Source: Western Digital Powerful ways data is changing our world
Conclusion
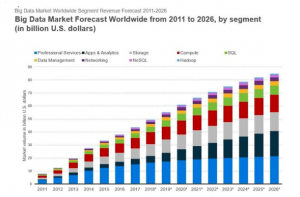
By 2026, the big data market is expected to top $92 billion. That’s a 307.8% increase over the $22.61 billion the market was worth in 2015.
The healthcare analytics market is projected to reach $24.6 billion by 2021. That’s a 187% increase from the $7.39 billion it was in 2016. And it represents a compound annual growth rate of 27.1%.
The uses of Big Data are virtually unlimited. From smart cities to international financial markets, to medical and pharma research, to agriculture and social innovations, the journey has just begun. In the world of data, significant changes are happening — some are obvious while others are below the surface. We’re only just starting to see how revolutionary big data can be, and as it truly takes off, we can expect even more changes on the horizon.
The ever changing landscape of ‘Digital’ today has led to mind-boggling amounts of data. The application surge, growth of e-commerce, virtually unlimited sources of unstructured data, a rise in merger & acquisition activity, increased collaboration, and the drive to harness information as a competitive catalyst for growth and innovation is driving enterprises to higher levels of consciousness about how data is managed at its most basic level. The effect of the e-commerce surge, a rise in merger & acquisition activity, increased collaboration, and the drive to harness information as a competitive catalyst towards both growth and innovation is driving enterprises to higher levels of consciousness about how data is managed at its most basic level. The top level strategy is often focused at bottom level data usage.